Critical Shifts:
-
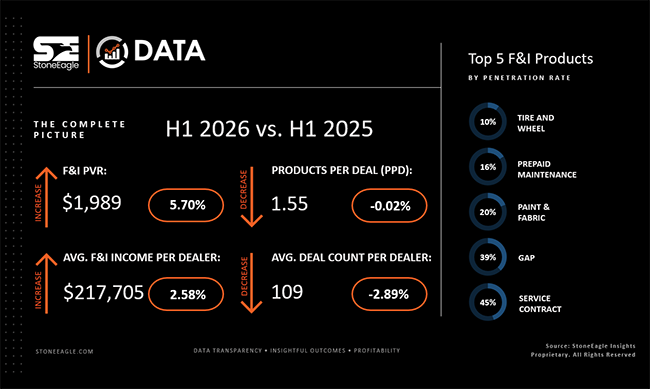
F&I Drives Dealership Profitability: F&I gross profit per vehicle retailed hit a record $1,989 in H1 2026, generating nearly 80% of total deal gross profit and driving average monthly dealer F&I income to a dataset record of $224,592 in Q2.
-
F&I Offsets Front-End Margin Decline: Rising F&I revenue directly offset severe front-end gross margin pressures, which fell to $536 per deal in H1 2026—down 81% from its peak in early 2022.
-
Financing Costs and Deal Sizes Rose: Despite average contract rates dropping from 7.93% to 7.55%, the average amount financed climbed over $2,000 to $38,221 in Q2, pushing average monthly payments up to $695.
________________________________________________________
StoneEagleDATA’s second-quarter and first-half 2026 results show a used and new vehicle retail market where F&I is becoming an increasingly important part of dealership profitability.
F&I gross profit per vehicle retailed (PVR) reached a first-half record of $1,989, up 5.7% from the same period in 2025. Average monthly F&I income per dealership increased 2.6% to $217,705, even though the average dealership processed 109 deals per month, down from 113 a year earlier.
The results highlight how F&I is offsetting continued pressure on front-end gross. Total gross averaged $2,525 per deal during the first half, down $122 from a year earlier. Front-end gross accounted for $536 of that total, a $229 decline from the first half of 2025. F&I, by comparison, generated nearly eight out of every 10 gross dollars per deal during the first half, according to StoneEagle.
The gap between front-end and F&I performance has widened considerably from the unusually strong gross margins dealers experienced during the inventory-constrained market of 2021 and 2022. Front-end gross peaked at $2,746 per deal in January 2022. It fell to $279 in December 2025 before recovering to $532 by June 2026, but remained 81% below that peak.
Second-quarter results provided much of the momentum behind the first-half F&I numbers. Average monthly deal volume increased from 106 in the first quarter to 112 in the second, while F&I PVR rose from $1,982 to $1,996. Average monthly F&I income per dealership climbed 6.5% from the first quarter to $224,592, making the second quarter the strongest quarterly average in the StoneEagleDATA dataset.
The transactions themselves also became more expensive to finance. During the first half, the average amount financed increased $1,928 year over year to $37,633. The average monthly payment rose from $673 to $685, while the average finance term remained relatively stable at 65.64 months, compared with 65.24 months a year earlier.
Second-quarter figures showed the same trend. The average amount financed reached $38,221, up $2,023 from the second quarter of 2025, while the average monthly payment increased from $680 to $695.
The higher payment came despite a decline in the average contract rate, which fell from 7.93% to 7.55%. The average finance term remained essentially unchanged.
Bottom Line
For independent dealers, the numbers point to a retail market in which the composition of gross has changed significantly. Front-end margins remain well below the levels seen earlier in the decade, while F&I is accounting for an increasingly larger share of the gross generated from each retail transaction.